Breaking News

Monday, 29 June 2015

The mineral from hell

04Torbernite
Torbernite
Torbernite from Margabal mine, Aveyron, Midi-Pyrenees, France.
Torbernite is the mineral from hell. The prism shaped green crystals form as secondary deposits in granitic rocks, and are composed of uranium. Formed through a complex reaction between phosphorous, copper, water and uranium, the stunning crystal displays have seduced many mineral collectors into taking a sample for a shelf collection. If the uranium decay from a pocket sized Chernobyl were not enough, lethal radon gas capable of causing lung cancer slowly releases from these hot rocks. This is one crystal to leave alone. Torbernite can occur in granite, so your stone countertop just might contain traces of torbernite. The bright green crystal blooms were used by prospectors as indicators of uranium deposits.

Saturday, 27 June 2015

Arsenopyrite can be dangerous !!!

05 Arsenopyrite
Arsenopyrite

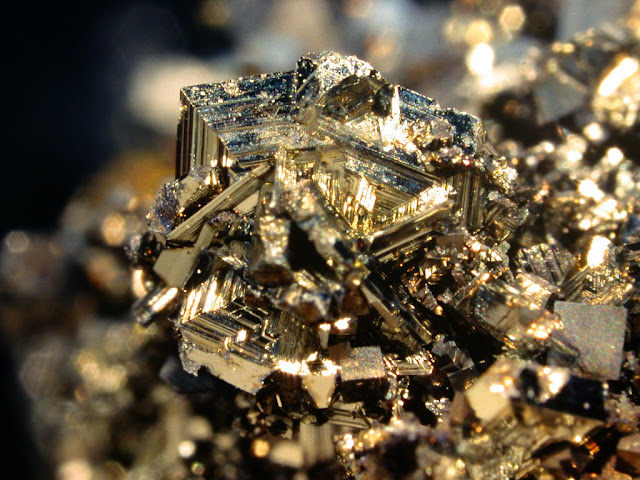
Arsenopyrite is fool’s gold, but with a difference. One would not just be a fool to mistake it for gold. Equally foolish would be a decision to pick up this mineral on a hike at a quarry, and proceed to use your hands to put trail mix in your mouth. Arsenopyrite is arsenic iron sulfide, which is the same type of mineral as pyrite (fool’s gold, iron sulfide), but with a heavy addition of arsenic. If one attempts to heat or in any way alter the mineral, a strong garlic odor of arsenic will be produced as lethally toxic, corrosive and carcinogenic vapors are released. Just handling the mineral brings one into contact with unstable sulfuric arsenic salts. Interestingly, arsenopyrite may be identified by striking a specimen with a hammer. The powerful garlic odor of arsenic can be briefly detected as the sparks fly.

Spatial Interpolation

Spatial  Interpolation

What is a spatial interpolation?
Interpolation predicts values for cells in a raster from a limited number of sample data points. It can be used to predict unknown values for any geographic point data: elevation, rainfall, chemical concentrations, noise levels, and so on.
On the left is a point dataset of known values. On the right is a raster interpolated from these points. Unknown values are predicted with a mathematical formula that uses the values of nearby known points.

Interpolation is based on the assumption that spatially distributed objects are spatially correlated; in other words, things that are close together tend to have similar characteristics.
It is important to understand that the interpolated values are approximations only of the real values of the surface and that the interpolated values differ depending upon the interpolation method used.

Why interpolate?
Visiting every location in a study area to measure the height, magnitude, or concentration of a phenomenon is usually difficult or expensive. Instead, dispersed sample input point locations can be selected and a predicted value can be assigned to all other locations. Input points can be either randomly, strategically, or regularly spaced points containing height, concentration, or magnitude measurements.
A typical use for point interpolation is to create an elevation surface from a set of sample measurements. Each point represents a location where the elevation has been measured. The values between these input points are predicted by interpolation.

There are effectively two types of techniques for generating raster surfaces
Deterministic Models use a mathematical function to predict unknown values and result in hard classification of the value of features.
GeoStatistical Techniques produce confidence limits to the accuracy of a prediction but are more difficult to execute since more parameters need to be set.

Deterministic Models
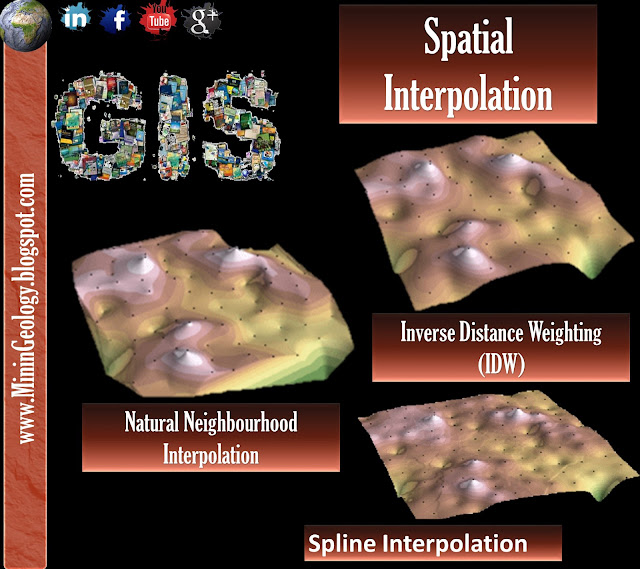
Deterministic models include Inverse Distance Weighted (IDW), Rectangular, Natural Neighbours, and Spline. You can also develop a trend surface using polynomial functions to create a customized and highly accurate surface.

1Inverse Distance Weighting (IDW)


The IDW technique calculates a value for each grid node by examining surrounding data points that lie within a user-defined search radius. The node value is calculated by averaging the weighted sum of all the points. A radius is generated around each grid node from which data points are selected to be used in the calculation.
Options to control the use of IDW include
Ø Power a high power more emphasis is placed on the nearest points and the resulting surface will have more detail and be less smoothed. Its values range between one and ten.
Ø  Search Radius defines the maximum size, in map units, of a circular zone centered on each grid node within which point values from the original data set are averaged and weighted according to their distance from the node.

The IDW is usually applied to highly variable data not desirable to local high/low values but rather to look at a moving average of nearby data points and estimate the local trends.

2Natural Neighbourhood Interpolation

Natural Neighbourhood Interpolation
It is like IDW interpolation, except that the data points used to interpolate the surface values for each cell are identified and weighted using a Delaunay triangulation.The method thereby allows the creation of accurate surface models from data sets that are very sparsely distributed or very linear in spatial distribution.
Spline estimates values using a mathematical function that minimizes overall surface curvature, resulting in a smooth surface that passes exactly through the input points.This method is best for gently varying surfaces, such as elevation, water table heights, or pollution concentrations. There are two spline methods…

3Spline Interpolation
Spline Interpolation

Spline estimates values using a mathematical function that minimizes overall surface curvature, resulting in a smooth surface that passes exactly through the input points.

This method is best for gently varying surfaces, such as elevation, water table heights, or pollution concentrations. There are two spline methods…

Spline the Regularized Method
The regularized method creates a smooth, gradually changing surface with values that may lie outside the sample data range.
Spline the Tension Method

It creates a less-smooth surface with values more closely constrained by the sample data range. For Tension, the higher the weight the coarser the generated surface. The values entered have to equal or greater than zero. The typical values are 0, 1, 5, and 10.

4Trend Interpolation

Trend surfaces are good for identifying coarse scale patterns in data; the interpolated surface rarely passes through the sample points.
Modelers often work to the "fifth order" polynomial analysis.
Trend Interpolation
A Trend surface for a set of points, in transparent grey, and the IDW interpolated surface for the same points. Spline and Trend interpolation interpolate best-fit surfaces to the sample points using polynomial and least-squares methods. 

Quantitative Mineral Resource Assessments

Quantitative Mineral Resource Assessments: An Integrated Approach

Policy makers, mineral exploration experts, and regional planners decide how public lands, which may contain undiscovered resources, should be used or whether to invest in exploration for minerals on a regular basis. Decisions are also made concerning mineral resource adequacy, national policy, and regional development. This book makes explicit the factors that can affect a mineral-related decision so that decision-makers can clearly see the possible consequences of their decisions. Based on work done at the US Geological Survey, the authors address the question of the kinds of issues decision-makers are trying to resolve and what forms of information would aid in resolving these issues. The goal of the process discussed is to offer unbiased quantitative assessments in a format needed in decision-support systems so that consequences of alternative courses of action can be examined with respect to land use or mineral-resource development. An integrated approach focuses on three assessment parts and the models that support them. Although the concepts presented are straightforward and understandable, in assessments, carefully listening to the experts in other disciplines leads to better products. Navigating through and making sense of QRA requires not just learning rules and equations, but life experiences and common sense. The judgment required to understand which tools to apply are best learned by example and experience. This will be useful to governmental or industrial policy makers, managers of explorations, planners of regional development, and similar decision-makers.

Download Here

6- a Killer Rock everywhere in our home

06 Asbestos

Asbestos is not a manmade product, but one of most terrifying minerals on the planet. Where other minerals act as toxins through their chemistry and sicken victims of accidental poisoning, Asbestos conducts full scale mechanical sabotage on the human lung. 

Asbestos is a fully natural category of minerals composed of silica the most abundant of Earth’s hard elements, iron, sodium and oxygen. Asbestos deposits consist of aggregates of thousands of tiny, fibrous crystals that can become airborne and lodged in the human lung. Carcinogenic effects occur through persistent irritation of the lung tissues, leading to scarring. Asbestos formations can also be uncovered among any set of silica rocks, warranting caution when exploring. Strangely, natural weathering leads to natural distribution of asbestos in Earth’s atmosphere. As a result, many humans carry some asbestos fibers in their lungs.

Types of Asbestose


Such an item is a small reminder of the U.S.'s history in asbestos mining, as there were many active asbestos mines across the country which supplied the once thriving asbestos industry. The more notable asbestos mining areas were located in California, Vermont, & Arizona, which ended production as recent as 2002.

However, although active asbestos mining may have ended in the U.S., the U.S. still imports raw, processed asbestos, to the tune of 1,100-tons (2,200,000-pounds) in 2011 alone; not to mention the fact that asbestos is still "legal" to use in many materials and applications in the U.S. and can still be found in building materials right off the shelf. Tragically, it's true.

Thursday, 25 June 2015

Rank 7 of Deadly Rock

07 Galena
Fluorite Galena Blanchard Mine NewMexico14cm

Galena is the principle ore of lead, and forms glistening silver cubes with almost unnaturally perfect shapes. Although lead is normally extremely flexible, the sulfur content of galena makes it extraordinarily brittle and reactive to chemical treatment. Galena is capable of taking an equally heavy toll on workers and amateur researchers who are exposed to it. Contact with specimens may lead to lead dust exposure, while workers in mines face a high risk of poisoning from contact with the mineral and the deadly dusts released through production. Once extracted, the lead content from this mineral poses environmental and health threats during treatment and extraction. Galena has a cubic fracture, and if hit with a hammer, the crystal will shatter into multiple smaller replicas of its original shape.

Hutchinsonite - The Deadly Rock


Hutchinsonite - Segen Gottes Mine, Wiesloch, Baden, Germany

08 Hutchinsonite


Thallium is the dark twin of lead. This thick, greasy metal is similar in atomic mass but even more deadly. Thallium is a rare metal that appears in highly toxic compounds consisting of rather strange combinations of elements. The effects of thallium exposure are even more peculiar, and include loss of hair, serious illness through skin contact and in many cases, death. Hutchinsonite is a hazardous but dramatic mixture of thallium, lead and arsenic. The three poisonous metals form a lethal mineral cocktail that should be handled only with great caution. Hutchinsonite was named after John Hutchinson, a prominent mineralogist from Cambridge University. The mineral is found in mountainous regions of Europe, most frequently in ore deposits.

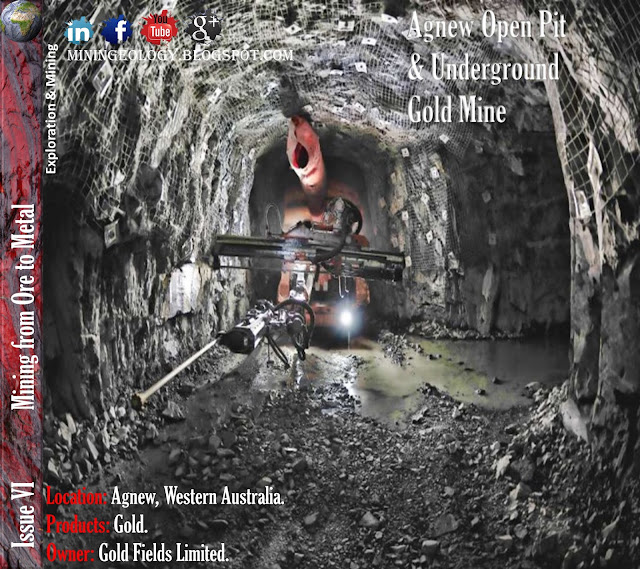
Agnew Open Pit & Underground Gold Mine

Agnew Open Pit & Underground Gold Mine

Location: Agnew, Western Australia.
Products: Gold.
Owner: Gold Fields Limited.
Mineral Resources at 3.5 Moz.
Mineral Reserves at 1.2 Moz.

Life of Mine extends to 2019 (7 years).


Licence status and holdings

The agnew gold mining company proprietary limited (agmc), can 098-385-883, was Incorporated in australia in 2001 as the legal entity holding and conducting mining activity on the Agnew mineral leases. The gold field’s limited group holds 100% of the issued shares of AGMC Through its 100% holding in the issued shares of orogen holding (bvi) limited. Agnew controls Exploration and mineral rights over a total area of 57,836 hectares (total of granted tenements) and has security of tenure for all current exploration and mining leases that contribute to future Mineral reserves.

Operational infrastructure
One underground complex, mining from two separate ore bodies (kim south and main north)accessed via declines. Centralised administrative office, engineering workshops and one cip processing plant (1.3 mtpa capacity).

Deposit type
Orogenic greenstone gold deposits hosted in a number of different styles of lodes. Although all of the agnew deposits broadly occur at the intersections between structures and stratigraphy, there are subtle differences in alteration and mineralisation, that are controlled in part by the local host rock chemistry.

Reporting codes Gold Fields reports its Mineral resources and mineral reserves in accordance with the 2007 Samrec code, the south african codes for the reporting of mineral asset valuation (2009 Samval code) and other relevant international codes such as the united states securities and Exchange commission (sec) industry guide 7, the joint ore reserves committee (jorc 2012) Code and the national instrument (Ni) 43-101. The mineral resources and mineral reserves are underpinned by an appropriate mineral resource management process and protocol to ensure adequate corporate governance in respect of the sarbanes-oxley act.

Agnew Gold Mine
Geological setting and mineralisation
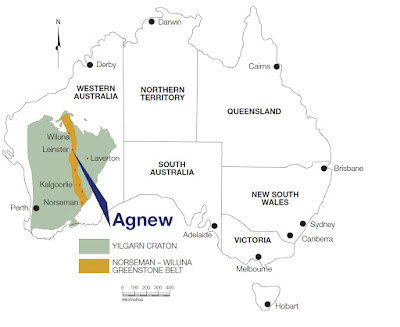
Agnew is situated in the northern portion of the Norseman- Wiluna greenstone belt, which is part of the yilgarn craton,A 2.6 ga granite greenstone terrain in Western Australia.
The rock types in the belt comprise abundant tholeiitic and Komatiitic volcanic rocks, chert, sulphidic and albiticSedimentary rocks, and a chain of discrete felsic volcanic Centres. The greenstones of the agnew area have been Metamorphosed to upper greenschist, lower amphibolite Metamorphic grades. Gold mineralisation is found in quartzBreccia lodes, quartz tensional veining and disseminated Arsenopyrite-pyrite-biotite mineralisation. This is developed along the lithological contact between a sandstone and ultramafic conglomerate and on other contacts within the ultramafic conglomerates package. High-grade ore shoots Plunge steeply to the north along these contacts. The controls on mineralisation are dilational zones at the intersection of steeply dipping north-south axial planar structures with the Stratigraphy. The stronger the contrast in rock competency in these zones, the greater the potential for mineralisation. Much of the yilgarn craton is deeply weathered and partially covered by tertiary and quaternary regolith. Pre-tertiary Lateritic horizons are variably exposed, stripped or buried by later deposits that have in turn been lateritised. The depth of Weathering is strongly controlled by original rock types, with mafic rocks generally being more susceptible to weathering than felsic rocks.
Although all of the Agnew deposits are broadly hosted by the intersections between structures and stratigraphy, there are subtle differences in alteration and mineralisation, controlled in part by the local host rock chemistry. Songvang is unusual in its relatively high lead, silver and fluorine content, possibly reflecting input from tonalite and porphyry intrusions. There also appears to have been a slight decline in mineralization temperatures from south to north through the Agnew area, associated with the north plunge of the Lawlers Anticline and resultant erosion of the overlying lower-temperature rocks to the south. This temperature change is reflected in the changing mineralisation styles from south to north, with biotite/garnet assemblages dominating to the south and quartz veining to the north. The stratigraphy of the Agnew-Wiluna belt appears to be broadly similar to the stratigraphy of the Kalgoorlie Region. The following section provides a detailed description of the general stratigraphy for the Agnew mining leases and the stratigraphic location of various ore bodies.

Mining methods
Access to the Waroonga underground mine is via a portal and decline, located in the previously mined Waroonga open pit. All primary infrastructures, including escape ways and ventilation shafts, are located in the competent sandstone of the hanging wall. The dimensions of the decline are 5.5 metres wide by 5.8 metres high, with arched backs to allow high-capacity trucks to operate.
The Rajah Lode was mined in 2012 using the modified Avoca Method. This is a variation of bench-stoping methodology where the fill typically consists of uncemented waste rock that is introduced to control wall stability at intervals from 20 to 30 metres. During 2012 the Main Lode North ore body was extracted using transverse stoping, with mining commencing at the footwall and retreating to the hangingwall. The stopes were accessed via a tramming drive developed in the hangingwall sandstone. The final northern cutback of the Songvang pit was completed in February 2012.


Mineral processing
The comminution circuit comprises a contractor-owned and operated three-stage crushing plant, feeding a fine ore stockpile, ahead of a two-stage closed circuit ball milling circuit. Milled ore proceeds to a three-stage leaching train feeding the six-stage carbon in pulp (CIP) circuit. Carbon elution is by pressure Zadra with gold being electro-won and smelted. In February 2003 a gravity circuit was retrofitted. It comprises a Knelson gravity concentrator and an intensive leach reactor (ILR) for intensive cyanidation of the gravity concentrate. The gravity circuit was upgraded and retrofitted in September 2011 to incorporate a second 26” Knelson gravity concentrator, an ILR 2000BA and two Magscreen 1000 units. The processing capacity at the plant is 1.3 Mtpa. Quantitative analysis of recovery improvements will be evaluated and included in future Mineral Resources and Mineral Reserve calculations in accordance with the grade/ recovery model currently adopted. Tailings disposal and impoundment have historically been to a conventional dam constructed using the upstream lift method sourcing wall material from dried tailings. The original tailing storage facility (TSF) was located in an area some 1.5 kilometres south-west of the Agnew plant. Deposition to this facility ceased in early 2004 and a large section of this decommissioned facility has been capped with waste rock.
The remaining exposed sections are being harvested for use as underground paste fill. Following completion of mining activities at the Redeemer Mine, the abandoned pit has been converted to a tailings storage impoundment for tailings arising from the Agnew plant (TSF3). Although situated seven kilometres south of the Agnew plant, the static head is negative, and pumping of the tailings material is therefore done at no additional cost from the previous deposition technique. The pontoon-mounted decant pump recovers water from the supernatant pond, which forms due to liberation of water from the tailings slurry as it settles and consolidates. TSF3 is projected to last until 2015, based on deposition rates of 1.3 million tonnes per annum and historical deposition levels from December 2004 to February 2011.

Mineral Resource classification

Mineral Reserve classification

Mine model of Agnew Waroonga ore body

Mine Model

Wednesday, 24 June 2015

Why Spatial Analysis

Why Spatial Analysis

Spatial analysis is how we understand our world—mapping where things are, how they relate, what it all means, and what actions to take.

From computational analysis of geographic patterns to finding optimum routes, site selection, and advanced predictive modeling, spatial analysis is at the very heart of geographic information system (GIS) technology.


The process of examining the location, attributes and relationships of features in spatial data through analytical techniques. It extracts or creates new information from spatial data.

Besides the visual perception of the spatial distribution of the phenomenon, it is very useful to translate the existing patterns into objective and measurable considerations, like in the following cases:


01Epidemiologists collect data about the occurrence of diseases. Does the distribution of cases of a disease form a pattern in space? Is there any association with any source of pollution? Is there any evidence of contagion? Did it vary with time ?

02We want to investigate if there is any spatial concentration in the distribution of theft. Are thefts that occur in certain areas correlated to socio-economic characteristics of these areas?

03Geologists desire to estimate, from some samples, the extension of a mineral deposit in a region. Can those samples be used to estimate the mineral distribution in that region?

04We want to analyze a region for agricultural zoning purposes. How to choose the independent variables – soil, vegetation or geomorphology and determine what the contribution of each one of them is to define where each type of crop is more adequate?

All of these problems are part of spatial analysis of geographical data. The emphasis of Spatial Analysis is to measure properties and relationships, taking into account the spatial localization of the phenomenon under study in a direct way. That is, the central idea is to incorporate space into the analysis to be made. This book presents a set of tools that try to address these issues. It is intended to help those interested to study, explore and model processes that express themselves through a distribution in space, here called geographic phenomena.